Study 1
Observing learning of an unconventional statistical graph
Introduction
What strategies do we employ to make sense of an unfamiliar
graph?
In this exploratory study we observed students solving problems with a
novel graph. After learning how the graph works, we challenged students
to design instructional aids to make the graph “easier to read”. From
these data we generate hypotheses for how we might scaffold
comprehension for novel representations.
To try the study yourself:
Print a copy of the
TM graph here
and questions
here
Methods
Design
Video-observation of problem-solving behavior + post-task interview
& design task. The entire procedure ranged from 45 - 60 minutes.
Participants
Twenty-three (70% female) English speakers from the
experimental-subject pool at a large American university (M(age) = 20,
SD(age) = 1) participated in exchange for course-credit. All students
were majors in STEM subjects. Participants were recruited in dyad pairs
(9 pairs, n = 18) to encourage the naturalistic think-aloud protocol. In
cases where one recruit was absent we conducted the session with the
individual (n = 5), altering the procedure only by encouraging them to
think-aloud as though explaining their reasoning to a partner. In total,
we conducted 14 observation sessions (9 dyads, 5 individuals).
Materials
Part A: Graph Reading Task
In the Graph Reading Task, sixteen multiple choice questions were
used to probe the reader’s ability to use the graph to reason about the
properties of and relations between intervals. For example, a question
testing the “duration” property might read: “For how many hours does
event [x] last?” Participants were given one sheet of paper containing
the questions and a second sheet containing a large TM graph with 15
data points. After delivering instructions, we started the video
recording and left the room. Questions can be found
here and TM graph here.
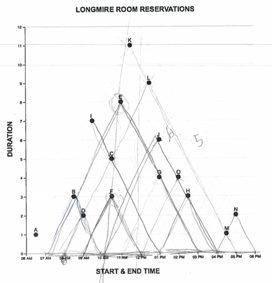
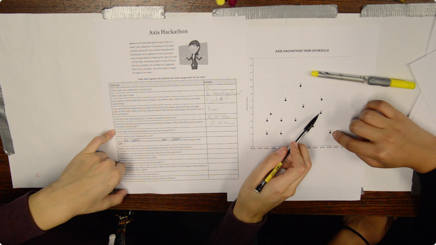 Figure 1. Setup of the Graph Reading Task
Post-Task Interview
Upon task completion, we conducted a short interview, prompting
participants to explain how they would plot a new data point on the
graph. If participants misinterpreted the graph, we began a didactic
interview, prompting students to ask questions they thought might help
them discover the rules of the graph system. We responded by only
revealing the information explicitly requested, minimizing the effect
our teaching might have on the designs produced in the next task.
Part B: Scaffold Design Task
The the Scaffold Design Task we asked participants to think about
what they could do to make the graph easier to read for the next
participant and invited them to make marks on the graph.
Results (Graph Reading Task)
Participants in only 3 of the 14 sessions correctly interpreted the
TM graph (M(score) = 12 / 16 points, (SD = 1.7), (M(time) = 19 min, SD =
30s). (see raw data here) These participants
correctly described the graph’s rules in the post-task interview. In the
remaining 11 sessions, participants correctly answered only 2.2 ques-
tions on average (SD = 2.1), and were unable to correctly plot a point
in the interview. Yet in these sessions, participants did persist in
answering all questions, spending about the same amount of time on the
task (M(time) = 21 min, SD=2 min).
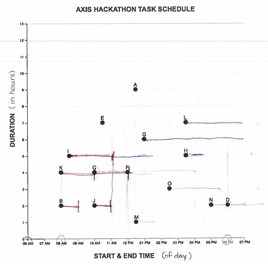
Reviewing the artifacts participants generated during the graph
reading task gives us a window into how they interpreted the graph.
Looking first at the lowest scoring sessions, we noticed several cases
where participants appeared to superimpose the conventional linear model
over top of the triangular graph (see figure 2) have dubbed this the
“linear interpretation” of the TM. This interpretation relies on
participants assuming that the data points are situated in a
conventional Cartesian coordinate system with a single x and y intercept
for each point. They must infer that a point represents a moment in
time, not an interval of time, and that the interval is represented by a
line segment which they must project (or draw) atop the graph. They must
also decide which moment along an interval the point represents. In this
sense, the “linear interpretation” relies on two kind of prior
knowledge: first of Cartesian coordinates in which a point has a single
x-intercept, and secondly of conventions for representing intervals: as
linear extents, rather than as points. In our sample, participants
decided the point referred to the start time. This interpretation also
requires students to ignore, or assign no meaningful referent to the
graph’s diagonal gridlines. Once constructed, participants can extract
information from the “linear interpretation” following the same
procedure one would follow for the LM graph.
 |
 |
 |
 |
Alternatively, In Figure 2b we see the artifact from the highest scoring session. Participants have reinforced the triangular intersections for several points with the x-axis. Noticeably, we do not see reinforcement of the intersections with the y- axis, presumably because this is a convention of the coordinate system participants did not need assistance to interpret.
Results (Scaffold Design Task)
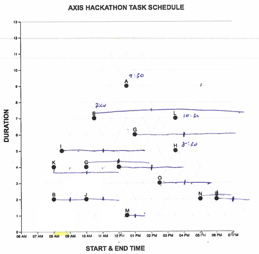
We evaluated the artifacts produced in response to our prompt to make the graph easier to read, and found evidence of three instructional approaches: adding pictorial intersections (Figure 3a), providing annotations/examples (Figures 3b, 3c) and text instructions (Figure 3d).
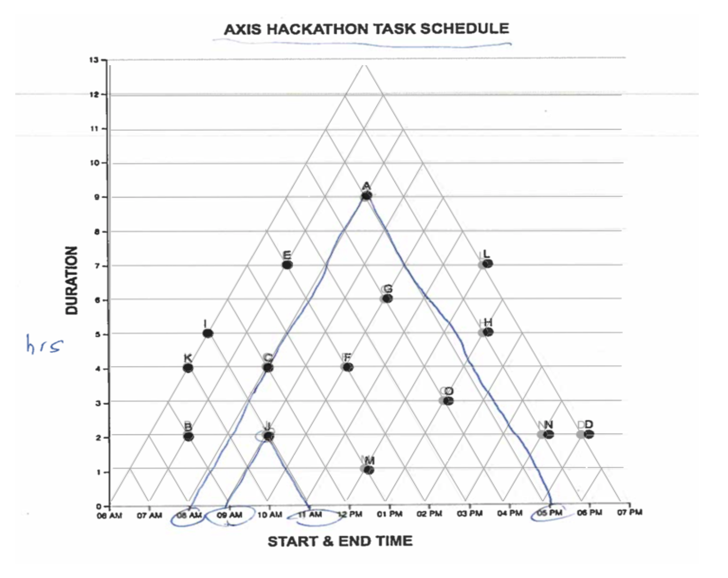 |
Figure 3A. Pictorial Intersections Participants have drawn attention to the diagonal gridlines and their dual-intersections with the x-axis by darkening and coloring them. These partici- pants explained the most challenging part of the graph was realizing they had to look for two intersections with the x-axis. |
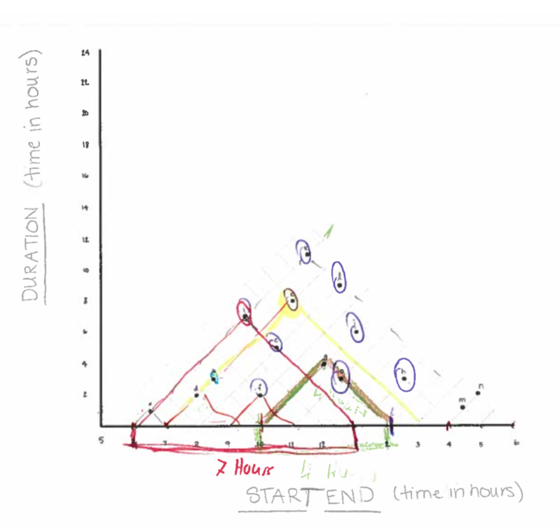 |
Figure 3B. Annotations & Examples. Participants have annotated their highlighted intersections. We see a partial worked example, via the annotation “7 hours” to the span for the red interval. |
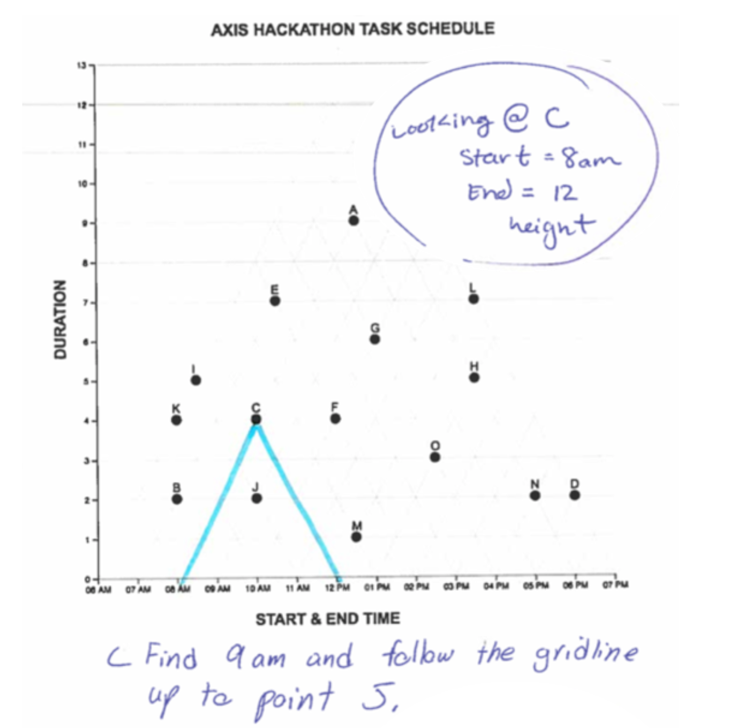 |
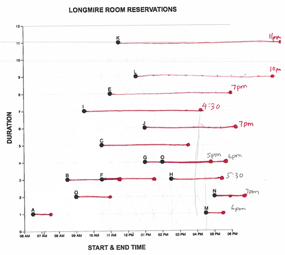
Figure 3C. Worked Example A worked example where participants both highlighted the intersection and gave explicit values for a sample point on the plot. Under the graph they added a production rule for finding the start-time of a hypothetical point “S”, indicating that some learners may prefer text in- structions. |
 |
Figure 3D. Worked Example Explanatory text with an explicit definition of several graph elements. |
Discussion
The results of Study One suggest the Triangular Model (TM) graph is challenging for STEM undergraduates. While the graph is elegant in its simplicity —as one participant noted, “once you see [the triangles], you can’t unsee them”— most re-imagined the marks on the page as components of the more conventional representation for intervals. In interpreting this graph students invoked prior knowledge of conventions for the domain (intervals as line segments) and graphs in general (Cartesian coordinates). When prompted for instructional aids, students believed they could easily improve performance of future participants by adding instructions highlighting the multiple intersections of a point with the x-axis. Importantly, these scaffolds are substantively different than those explored in previous literature. These instructions are most similar to graphical cues, but rather than reinforcing the main argument of the graph (e.g. local maxima/minima, salient trend, etc.) they draw attention to the structure of the coordinate system. Both text and image instructions focus on the graphical framework and how to perform a first-order reading, rather than reinforcing the connection between the graph’s signifiers and referents. Owing to the limited sample size and observational methods, we fall short of explaining why some students (3 sessions) were able to interpret the graph while most were not. In one case, an individual interpreted the graph in the very first question, but failed to think-aloud, leaving their strategy a mystery. In the second case, the dyad pair also developed a correct model in the first question. In the third case, the dyad read the graph incorrectly for about half the questions before realizing their mistake and re-solving the problem set. These outcomes could be driven by individual differences in graphical competency, or different problem-solving strategies. Addressing this question will require further observation with directed post-task interviews.
Copyright © 2018 Amy Rae Fox. All rights reserved.